Discover how US agriculture maps reveal the diverse farming practices and crop distributions across the nation.
Look Inside:
National Agricultural Statistics Service
This mighty entity loves to collect, analyze, and share a treasure trove of data about everything that grows in the good ol’ U.S. of A. They’ve got an eye for detail and a knack for numbers. Picture them as the Sherlock Holmes of American farming!
- Here are some cool things they do:
- Conduct regular surveys and censuses of virtually every crop and livestock in the country.
- Provide up-to-date stats on production, acreage, and yields.
- Offer insights into farming economics, including prices, costs, and income.
They are like the ultimate cheat sheet for farmers, researchers, and policymakers.
Access Quick Stats (searchable Database)
Fancy yourself a data sleuth? Dive into agricultural statistics using the USDA’s user-friendly searchable database. It’s like a treasure map but with less “X marks the spot” and more “acres of corn harvested.”
Here are some golden nuggets to get started:
- Browse by commodity. Want to know how many potatoes Idaho’s churning out? Tap, type, and boom! Instant spud stats.
- Drill down to specifics. State-level data is so yesterday. Get county-level insights and feel like a local farming guru.
- Create custom queries. Feeling fancy? Tailor your search with filters and get the exact data you dream about.
This tool is great for researchers, policy-makers, or just about anyone with a penchant for agricultural trivia. Happy data hunting!
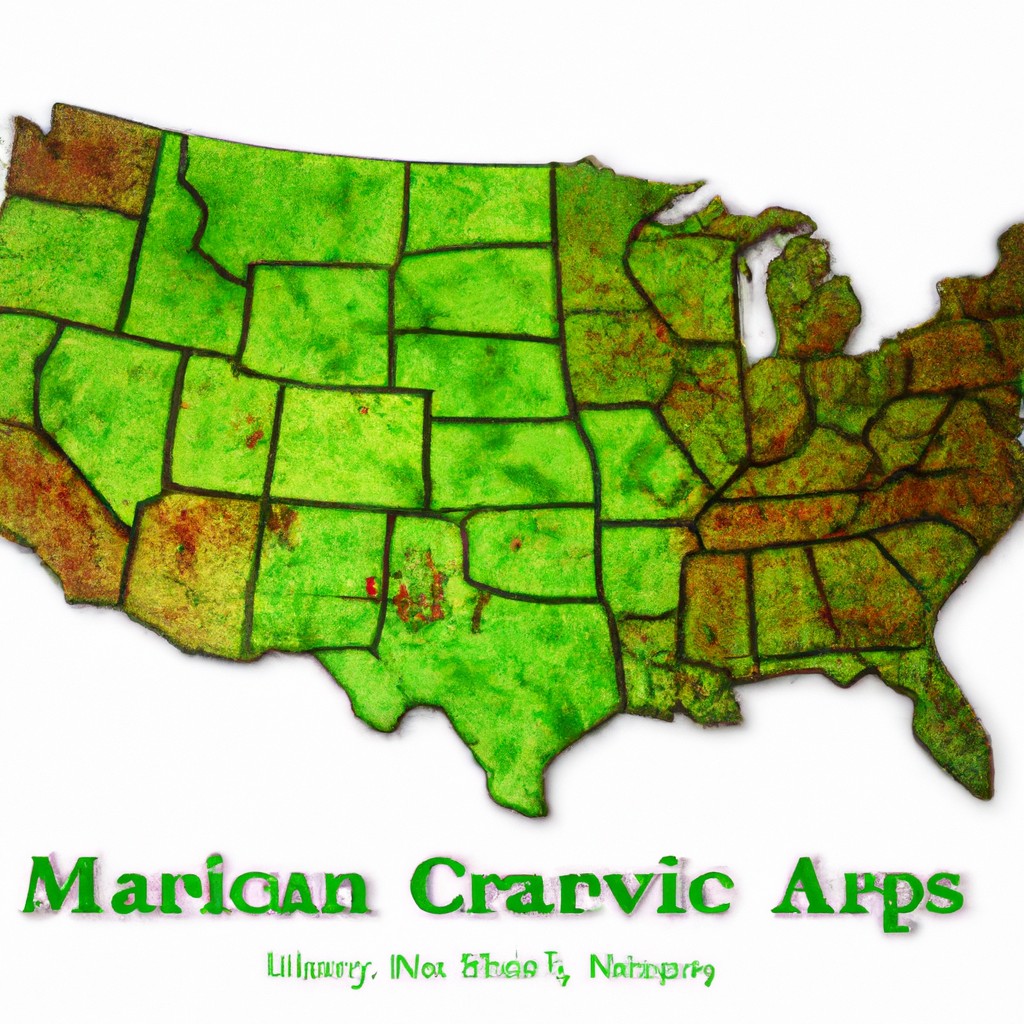
Charts and Maps
Get ready to geek out with visual data. When it comes to agricultural charts and maps, it’s all about seeing the bigger picture without needing a microscope.
One super-cool thing about these resources is how they break down complex data into snack-sized visuals. No need to sit through a graphic design course – just click and get instantly digestible info.
You’ll find maps showing crop distribution across states. Ever wondered where all the soybeans are? Now you don’t have to. Boom – there’s a map for that.
There are also charts tracking livestock populations. Imagine checking out the cattle count in Texas versus, say, New Hampshire. Spoiler: Texas usually wins that race.
Weather trends over the years? Yup, those too. Farmers need to know if they’re in for a dry spell or a monsoon season. These charts have got their backs.
And if you’re into economics, production value charts show you the monetary muscles of different crops. Wheat isn’t just for bread – it’s a gold mine in graph form.
So, whether you’re farming fields or just feasting your eyes, these tools make the data dance effortlessly at your fingertips.
S. Geological Survey
Let’s dive into the magic that is the US Geological Survey.
Imagine having a spyglass that peeks into the secrets beneath your feet. That’s what the USGS does for agriculture. They map out soil types, water resources, and all the hidden details that make farming fun (and functional)!
- Topography: Picture a 3D landscape of valleys, hills, and plateaus—essential data for determining which crops thrive where.
- Soil Composition: From sandy regions perfect for peanuts to loamy soils where tomatoes feel right at home, the mapping provides essential soil details.
- Water Resources: They track groundwater levels and surface water bodies—so you can water your greens without breaking a sweat.
- Climate Data: From frost warnings to rainfall predictions, this data is crucial for planning crop seasons.
Thanks to the USGS, farmers get a backstage pass to Mother Nature’s grand performance!
Contact USGS
Remember the last time you got lost in a corn maze? Well, the USGS is like that trusty map that helps you find your way out. When in doubt, just reach out!
The USGS is your best buddy for any geographical data on U.S. agriculture. Their team is super helpful and responsive. Whether you need a detailed soil map or want to know about land use, they’re just a call or an email away.
- A few pointers:
- Visit their website for an ocean of resources.
- For specific questions, use their contact form. It’s like shooting a basket – quick and easy.
- If you’re old-school and prefer a chat, give their helpline a ring.
You’ll be out of that metaphorical corn maze in no time, thanks to the USGS folks!
Related Reading
 15 Lucrative Agriculture Business Ideas to Boost Your Success
 Secretary of Agriculture Responsibilities: What They Actually Do
 Agricultural Commodity Prices Today: Your Daily Digest
 Biggest Agriculture Companies: Giants Feeding the World
 Sedentary Agriculture: Transform Your Soil Without Moving an Inch